As you all know, Open Source software (OSS) proposes a collaborative development model where the code is accessible and anyone can contribute. However, this very own collaborative nature becomes one of its main sources of problems, as developers abandoning the project causes serious sustainability problems.
As such, the long-term sustainability or, at the very least, the level of activity of a project and its temporal evolution, should be a factor to consider when choosing the best OSS match for our goals. Unfortunately, the task of exploring and selecting OSS projects is not an easy task. Current filtering and query criteria supported by platforms such as GitHub are not sufficient to effectively locate good project candidates. Even less when it comes to choose projects that we want to make sure they are still alive and kicking.
In our paper “An Empirical Study on the Survival Rate of GitHub Projects“, to be presented at the Mining Software Repositories ’22 conference, we take a new approach to this problem by applying survival analysis to GitHub projects. This type of analysis pays special attention to the time-dependent nature of the OSS project information and allows us to understand the probability of survival of OSS projects. More specifically, we perform a quantitative analysis of the survivability of OSS projects over time, focusing on their survival rate, evolution dynamics and the identification of factors that positive correlate with higher surviving rates. We focus our analysis on four software ecosystems in GitHub, specifically: NPM packages, R packages, WordPress plugins and Laravel packages. Among these ecosystems, we study the activity of a set of GitHub repositories created in 2016 and observe their evolution until October 2021.
More specifically, we have identified the following two research questions:
- RQ1: How does aproject activity change over time? This research question analyzes the different status (or phases) a project may transition during their lifespan (e.g., periods of time with high activity and others when the project may look dead). By studying the evolution of the project activity, we can better understand the dynamism and common evolution patterns of projects’ lives.
- RQ2: What is the survival rate? In this research question, we focus on identifying projects that have died and when they have died (i.e., been abandoned and with no human activity). We then calculate the survival rate (i.e., dead vs. alive projects) which will allow us to understand the survivability of the projects across a number of dimensions.
Now, before revealing our findings, we dig a bit deeper in the development of this study. First, I will explain the concept of survival analysis, then I will define what is time series data and how we store it, and at last I will report the dataset construction process and its main descriptive statistics.
Survival Analysis
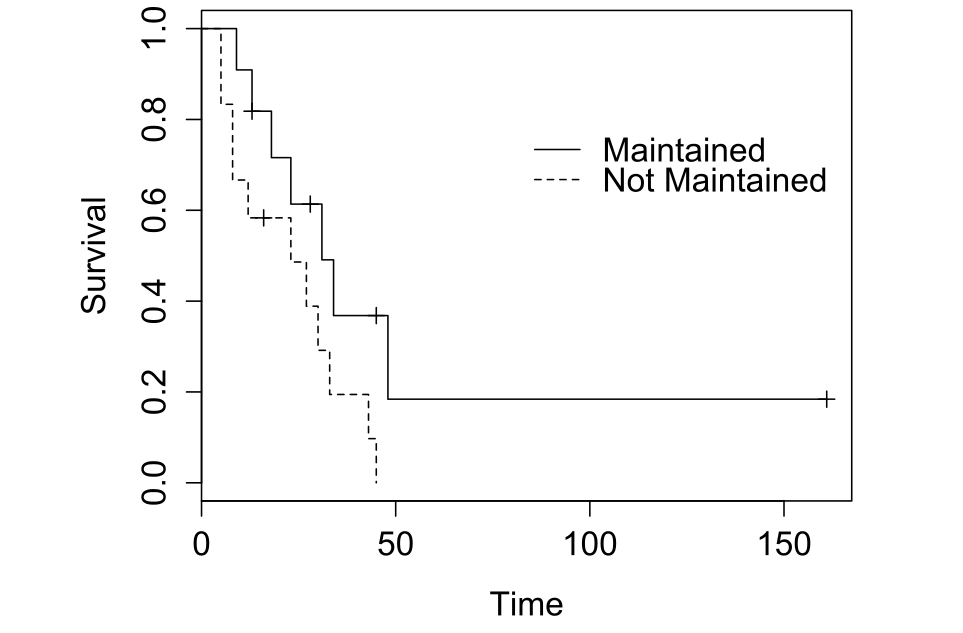
Survival analysis is a statistical modeling technique to study the expected time for an event to occur. By applying survival analysis, we study the proportion of population which will survive to a particular event in a given period of time. Furthermore, survival analysis also considers censoring, which occurs when we have information about individual survival time, but we do not know the survival time exactly.
In the context of this paper, we consider that a project survives when its development has not been abandoned at the time we collected the project’s data activity (i.e., end of our study). Thus, the death event comes after a project activity stops. Note that censoring may occur whether a project is alive at the time we collected the data, but it is later abandoned. This situation is called right-censoring and usually happens in any kind of survival data as the event can generally occur after conducting an empirical study.
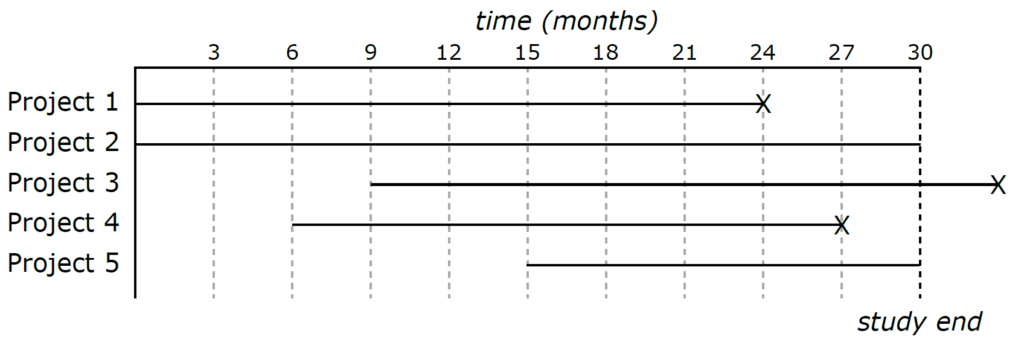
Figure below shows different examples of projects that may be found in our study. As can be seen, projects 1 and 4 are considered abandoned ones (i.e., dead) while projects 2, 3 and 5 are considered alive ones; at the time our study ends. Note that project 3 is a right-censoring case, as it is considered alive, but it is later abandoned.
Time Series Data
Time series analysis refers to the set of methods and techniques to study sequences of data collected over an interval of time for a set of events. What sets time series data apart from other data is that the analysis can show how variables change over time. Thus, the temporal dimension is a key part of this type of data.
Time series databases (TSDB) are a specific type of databases tailored to the analysis of time series data. This kind of databases offers support for (1) storing and retrieving time series data; (2) scaling, as time series data are extensive; and (3) providing visualization tools or easy integration components with third-party visualization tools,which are common tasks in time series analysis. In this study, we have used TimescaleDB, a relational TSDB built over PostgreSQL.
Dataset Construction
To build our dataset we decided to select a set of GitHub projects within specific ecosystems. Focusing on specific ecosystems ensures similar development practices and structure but also high variety on their purpose. To select the projects we applied the following criteria: (1) they have been created in 2016, (2) they have been updated at least once in 2016, and (3) they are part of the ecosystem of interest.
To gather the data from the GitHub repositories we cloned and analyzed the selected projects. The analysis was performed by SourceCred , a measurement tool for collaborative solutions such as GitHub projects, among others. SourceCred builds a collaboration graph from GitHub projects, where nodes represent assets of the repository and edges represent relationships among them. The graph also includes temporal information (e.g., timestamp of the creation of a commit or an issue), which we used to perform our study. From these collaboration graphs, we populated our TimescaleDB database.
Results
RQ1: How does the project activity change over time?
The analysis of projects’ activity evolution during their lifetime reveals an intermittent activity, which moves from running (i.e., any activity) to dead (i.e., no activity at all) states. Besides, the average time in dead state is approximately two times the average time in the running state, thus revealing longer periods of inactivity.
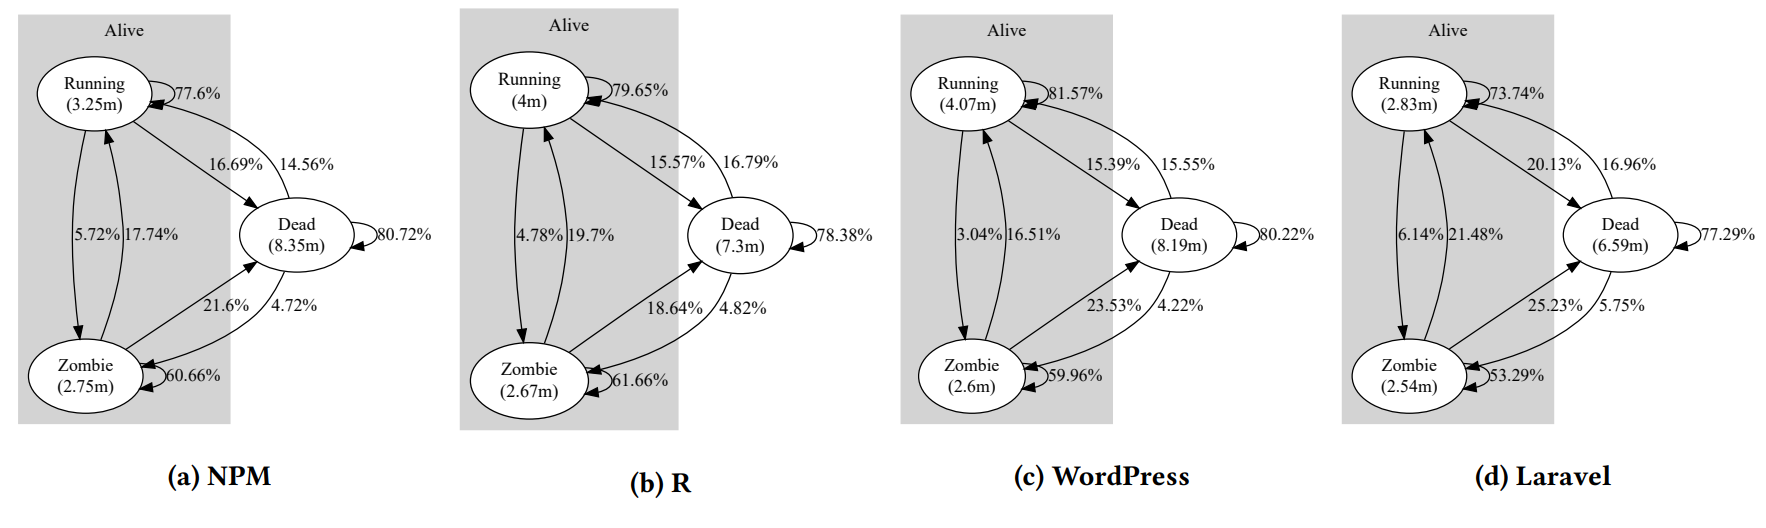
State machines representing the evolution paths in each ecosystem. State labels indicate the name of the status and
the average time (in months). Transition labels indicate the probability to change status each month.
On the other hand, we detected that when a project moves to the zombie state (i.e., non-development activity) it unlikely it will move back to the running state so it’s important to keep the developers engaged. These results suggest that the typical development process in the four ecosystems evolves in short intensive periods of time with long periods of inactivity. When having into account the project type and community size factors, we found that projects owned by organizations ensure higher levels of activity, and the same happens for those projects with bigger community sizes.
RQ2: What is the survival rate?
In this research question we analyze the survival rate of the projects considered in our dataset. While the previous research question focused on the monthly evolution of projects’ activity status, this research question considers how many of them were dead at the end of the period of time considered in our study.
More than a half of the analyzed projects die in their first four years. In fact, the probability of survival is lower than 50% beyond the fifth year of life as you can see in the next figure. When considering the project type and community size factors, organization projects have a higher probability of survival, and the same happens for projects with bigger community sizes.
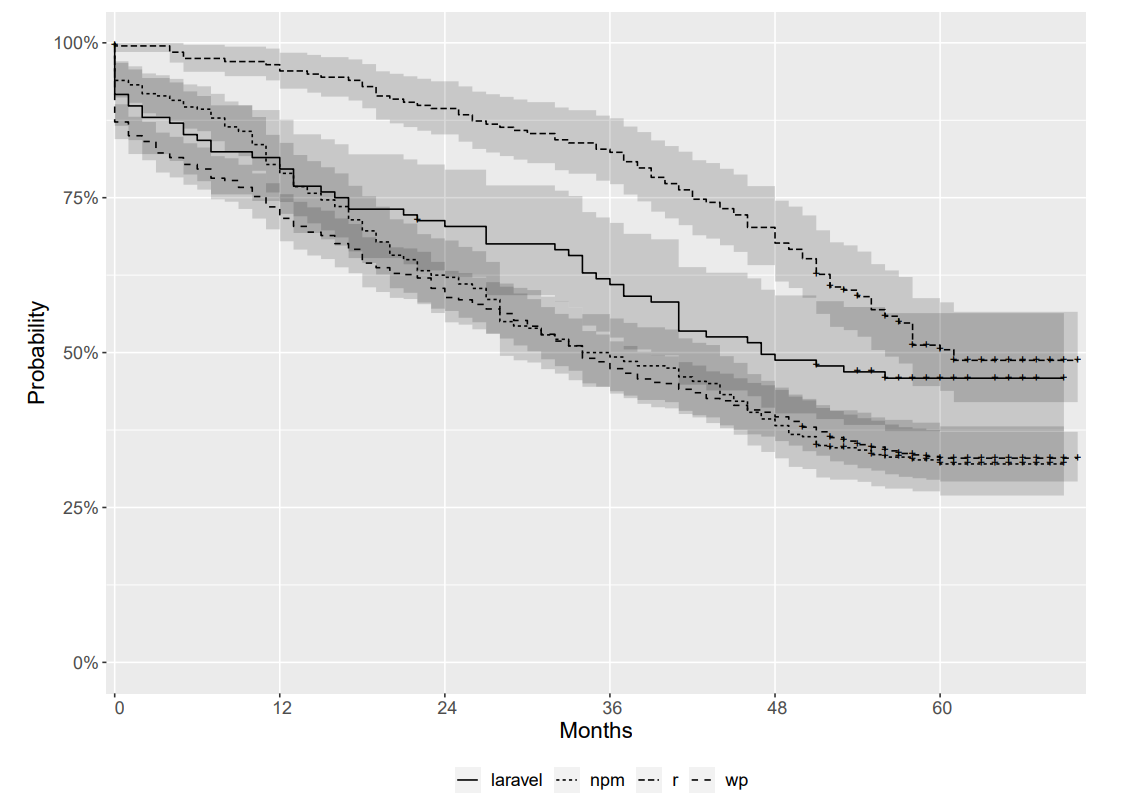
Probability of survival over time
We believe these results are useful to understand the dynamics of Open Source in online platforms such as GitHub. These results are also useful to raise awareness on the volatility of Open Source projects and the risks incurred by many organizations that heavily rely on Open Source projects without paying attention to their health nor contributing to their sustainability.
It could be argued that some projects are small and focused, and therefore their development naturally stops shortly after its creation. We believe this may be true only for a few number of projects as at least some minimal maintenance work (e.g., to fix potential security vulnerabilities) is generally required, as it happens in the projects of our dataset, where projects are packages (or libraries) from an evolving software ecosystem.
There are plenty of follow-up questions to this initial study (including trying to use this type of data to predict future survivability of specific projects!) so we’ll be happy to discuss further the topic with all of you, here or at MSR’22!
Featured image from commons.wikimedia.org
Research Engineer at IN3-SOM Research Team, in Barcelona, Spain. Currently studying a data science master. Interested in open source dynamics and collaboration.