We have been studying what characterizes a software project as open. Our aim is to come up with a set of metrics to measure the level of openness in open source projects. In this blog post we will describe the work we have carried out in this direction.
Openness is generally defined as a tendency to accept new ideas, methods or changes. This definition can be adapted to the field of Open Source software development as the tendency to accept changes from non-project members and to allow them to participate in the decision-making process of the project.
We believe that the openness level of an open source project can influence the enthusiasm of new developers to join a project. Thus, we propose three new metrics to allow gaining more insights into the openness level of an open source project. Next we briefly describe each metric and show some results for a subset of GitHub projects (included in a snapshot of the GHTorrent dataset), in particular, to 91 original projects (i.e., projects that have not been forked from another project) included in the dataset:
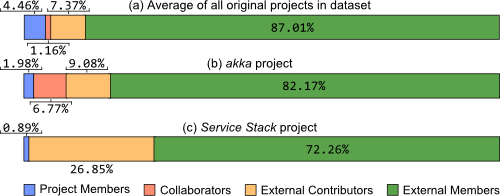
- Community composition. How the community of the project is composed in terms of project and non-project members? We defined four groups of users: (1) project members (including the owners); (2) collaborators, who are granted with the permission to manage the project, but are not part of the project members group; (3) external contributors, who perform pull requests but do not have the permission to accept or close them; and (4) external users, everyone else that contributes to the project but is not included in the previous groups. The analysis of the community composition may help to understand how the responsibilities are distributed in the community but, more importantly, how non-project members are involved.
The average result regarding the community composition for all the original projects is shown in the following figure, section a. As can be seen, in average only 13% of the community is willing to contribute to the code (the sum of project members, collaborators and external contributors). It is also important to note that the role of collaborator is scarcely used. This could be interpreted as that most projects prefer to keep a centralized authority (an exception would be the akka project also shown as example in the Figure, section b). The number of external contributors could also be regarded as low but there also some important exceptions (like ServiceStack, in the Figure, section c) showing that some projects do a good work in attracting volunteers.

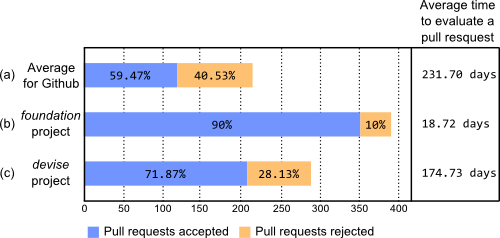
- External contribution analysis. How many external contributions are accepted? How long does it take to evaluate an external contribution? This metric may indicate how project members take into consideration external contributions as well as it may serve to encourage (or discourage) external contributors to participate in the project.
The following figure shows the results obtained for this metric. On average, 59.47% of pull requests are accepted and it takes around 231.70 days to address them. That it takes so long so evaluate a pull request came as a surprise and poses some questions about the agility of open source projects. Obviously, these numbers vary a lot from project to project. Thus, we have selected the projects foundation and devise as illustrative examples. The foundation project accepts almost all pull requests (90%) and it does it really fast. This is even more impressive given the number of pull requests it gets (almost 400 so far). On the other hand, the devise project takes more time to deal with a lower amount of pull requests.

- Time to become collaborator. How long does it take to become collaborator? The study of how long it takes to become a collaborator may help to better assess the openness level in GitHub projects.
The results of this metric are shown in the boxplot of the following Figure. The average time is calculated only for those projects in which at least one external contributor became collaborator. The average results for the original projects in GitHub shows that the median value is 147.83 days. These values can be used to evaluate other projects in the dataset. For instance, the project elasticSearch has a value of 413.70, which is outside the box and may indicate a reluctance to grant management permission to external contributors.

The full report and some extra explanations can be found at here.

Associate Professor at Universitat Oberta de Catalunya and researcher at SOM Research Team, in Barcelona, Spain, he likes investigating on how software is developed, in particular how open-source software is developed and how people collaboratively drives the creation process. He has been working mainly in the area of programming & domain-specific languages, modeling, modernization and model-driven engineering.

